CanHealth AI Validation Study
Publication Figures — Vancouver Coastal Health Authority & Sapien Secure Inc.
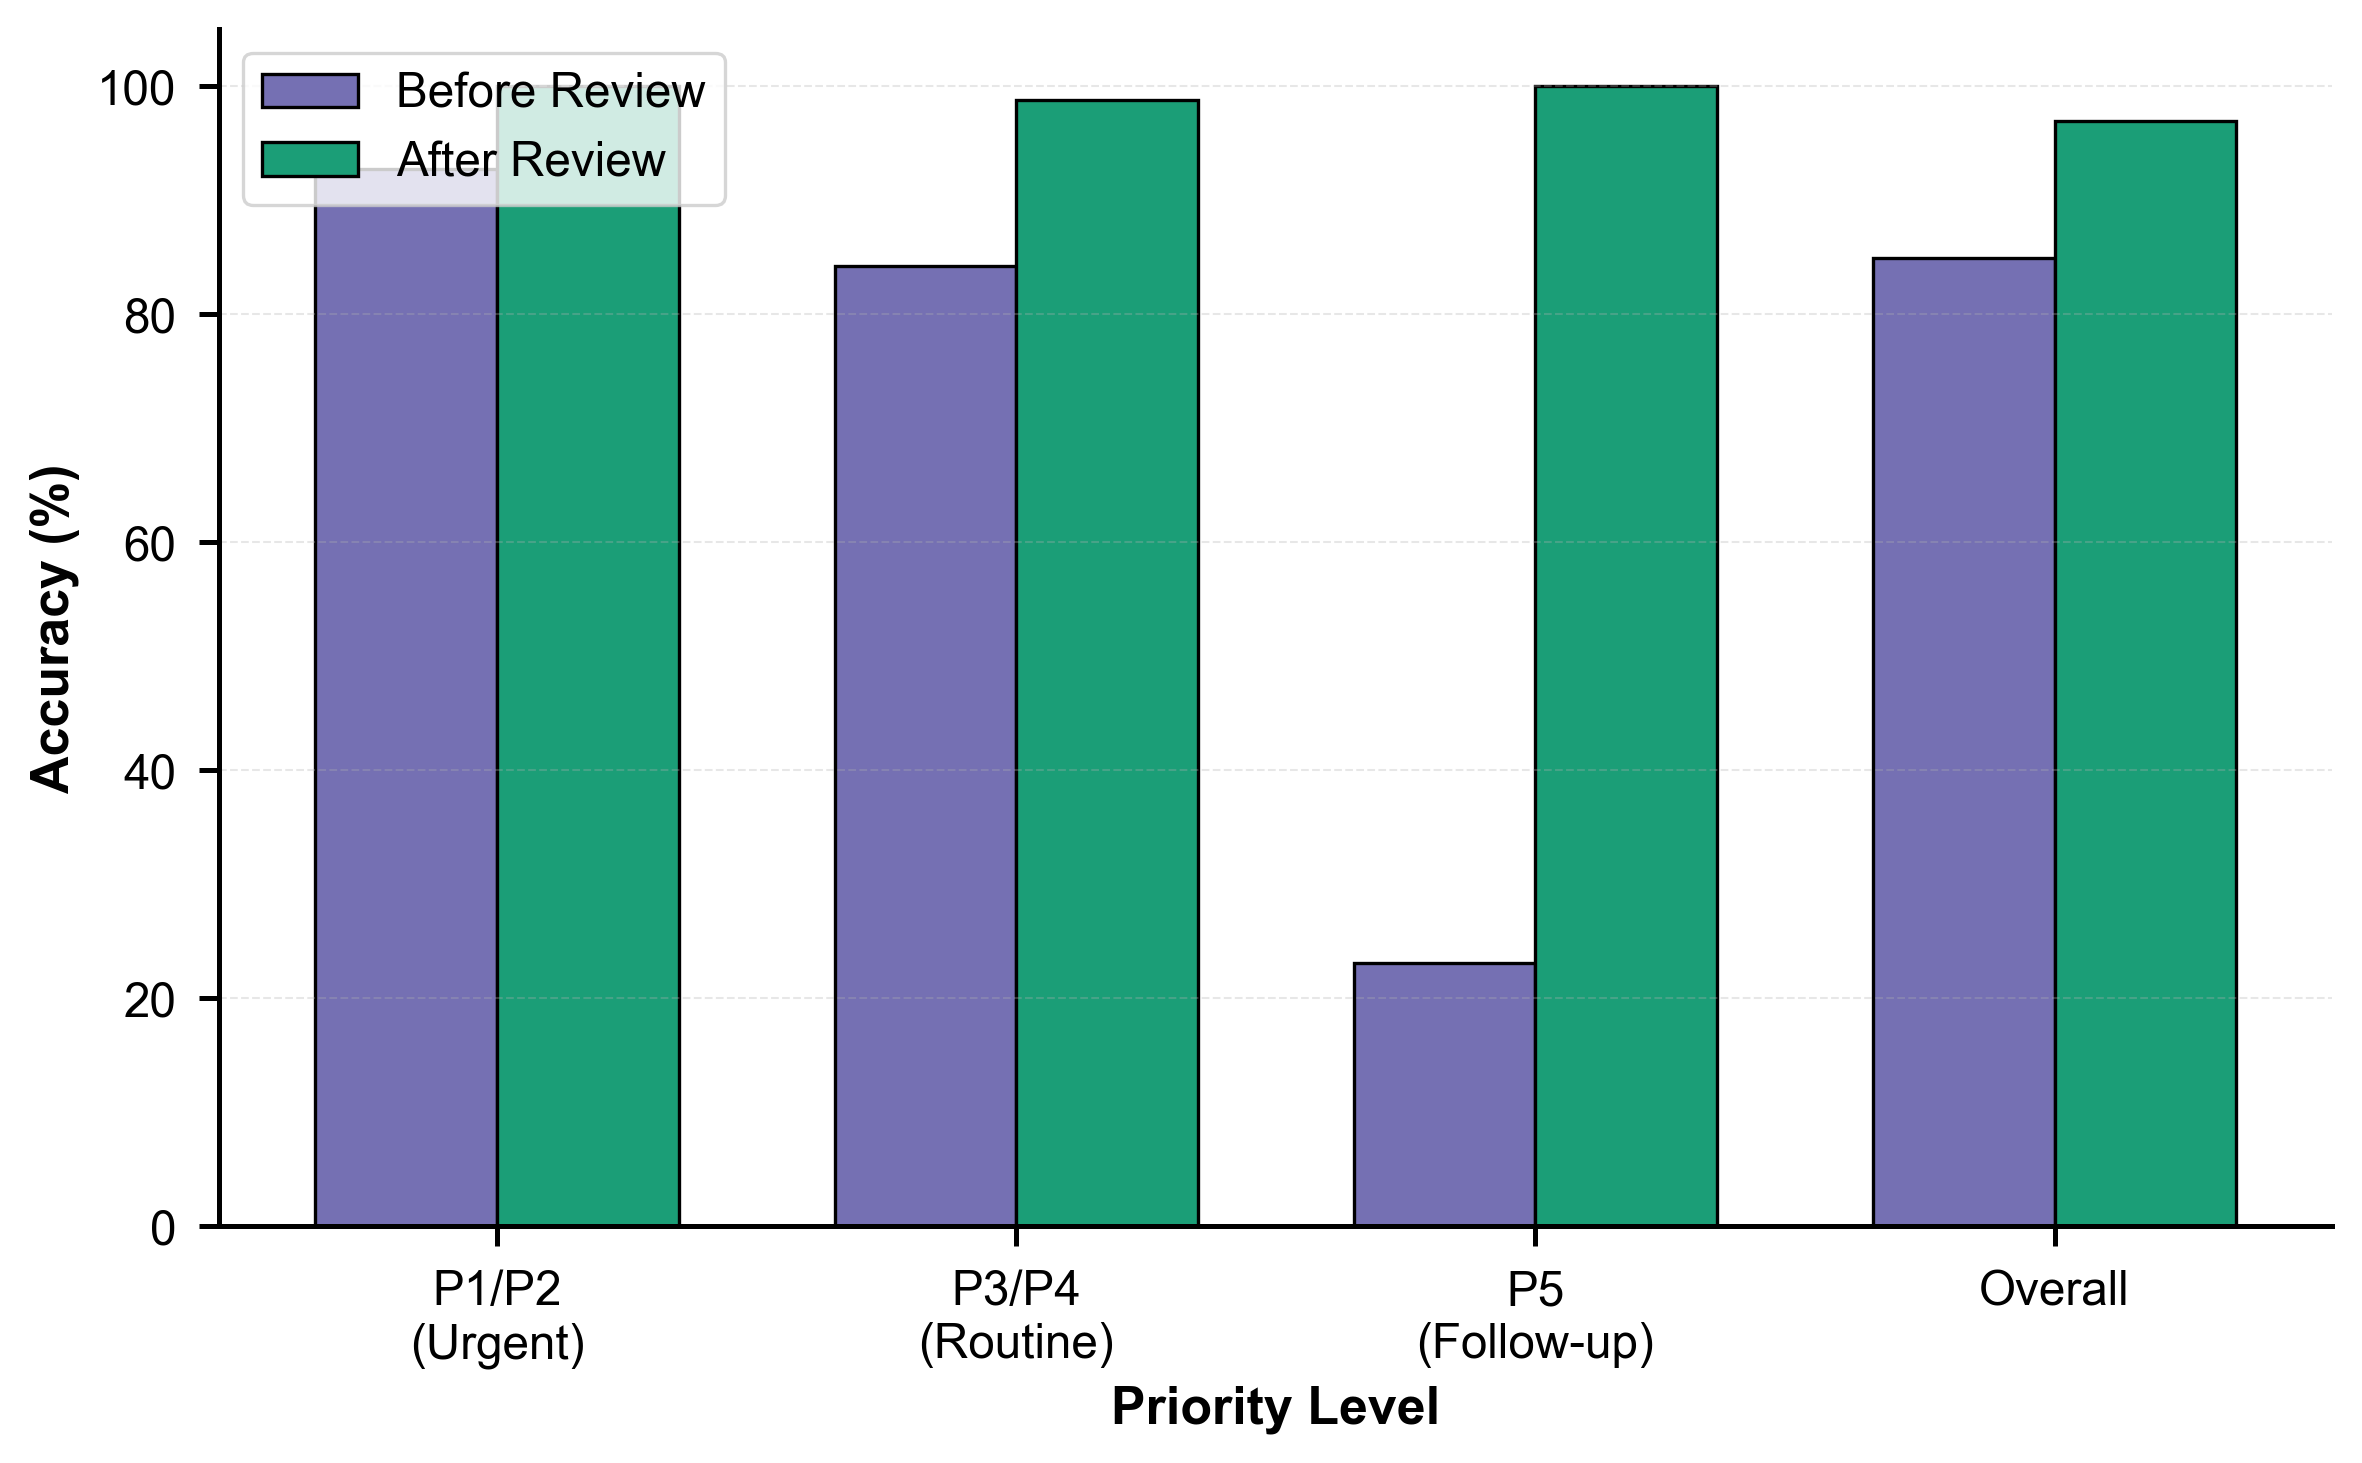
Figure 1. AI accuracy by priority level before and after panel consensus review. The AI achieved 96.9% overall accuracy after review, with perfect performance (100%) on high-acuity P1/P2 cases.
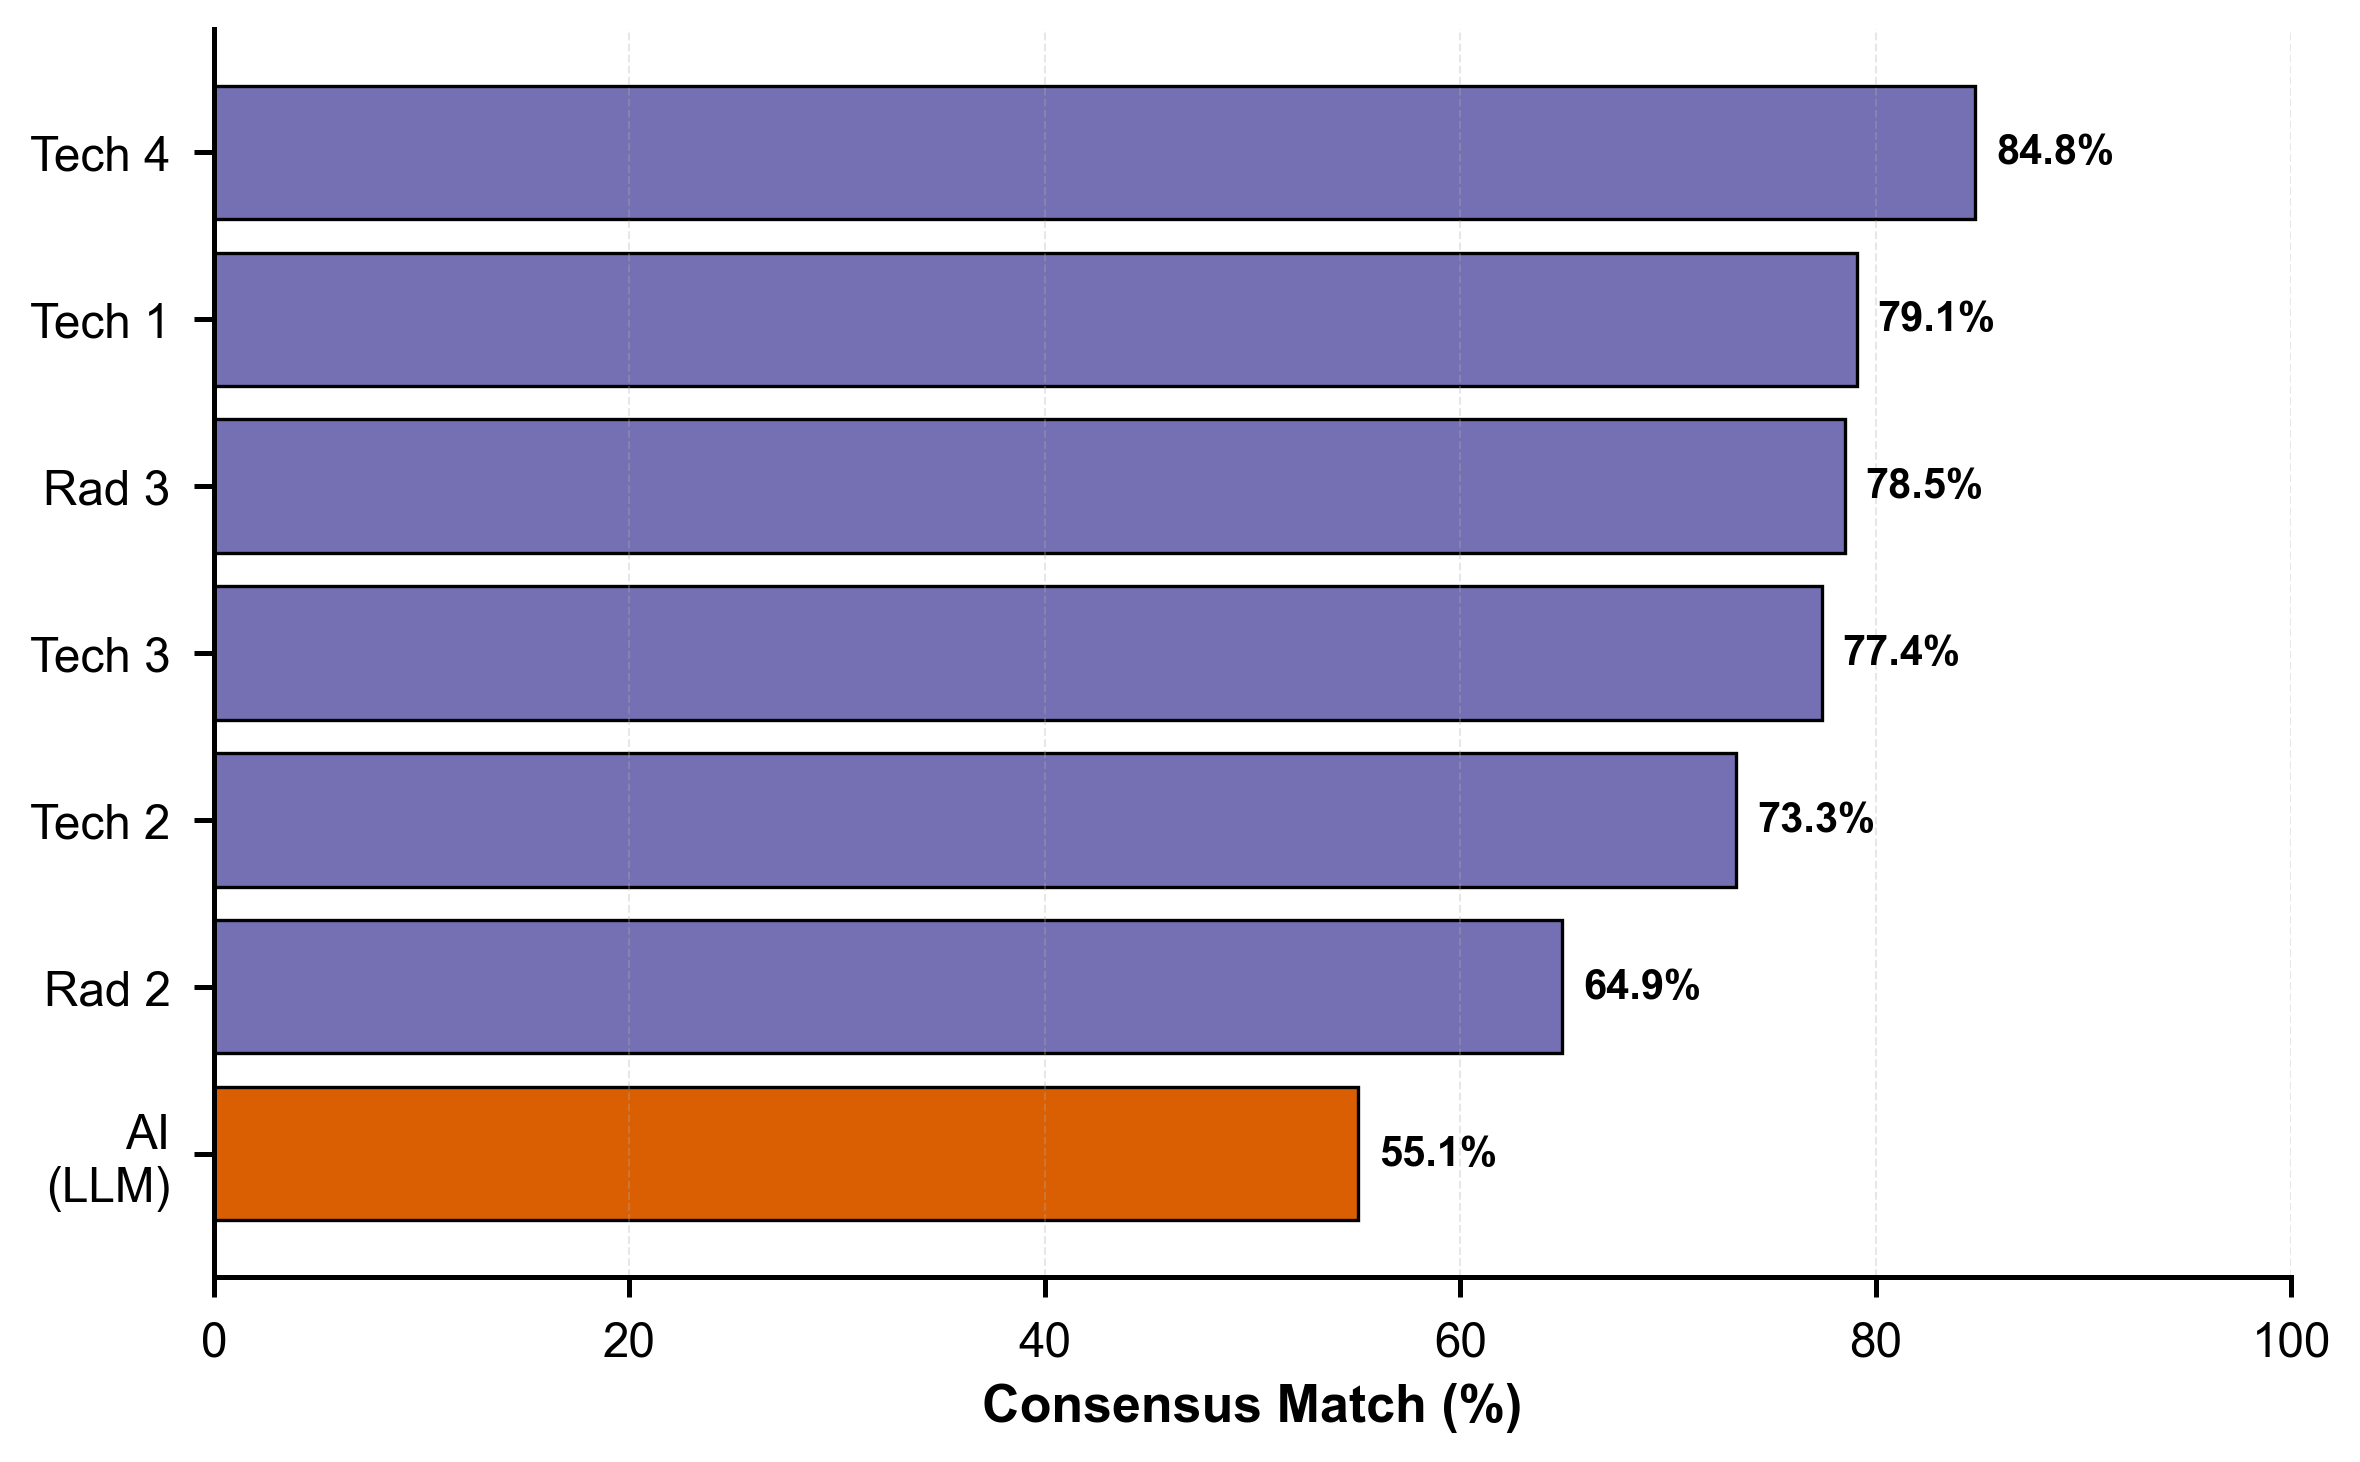
Figure 2. Consensus match rates for AI and individual human expert evaluators (blinded phase). The AI achieved 55.1% consensus agreement, lower than all human experts (range: 64.9%–84.8%).
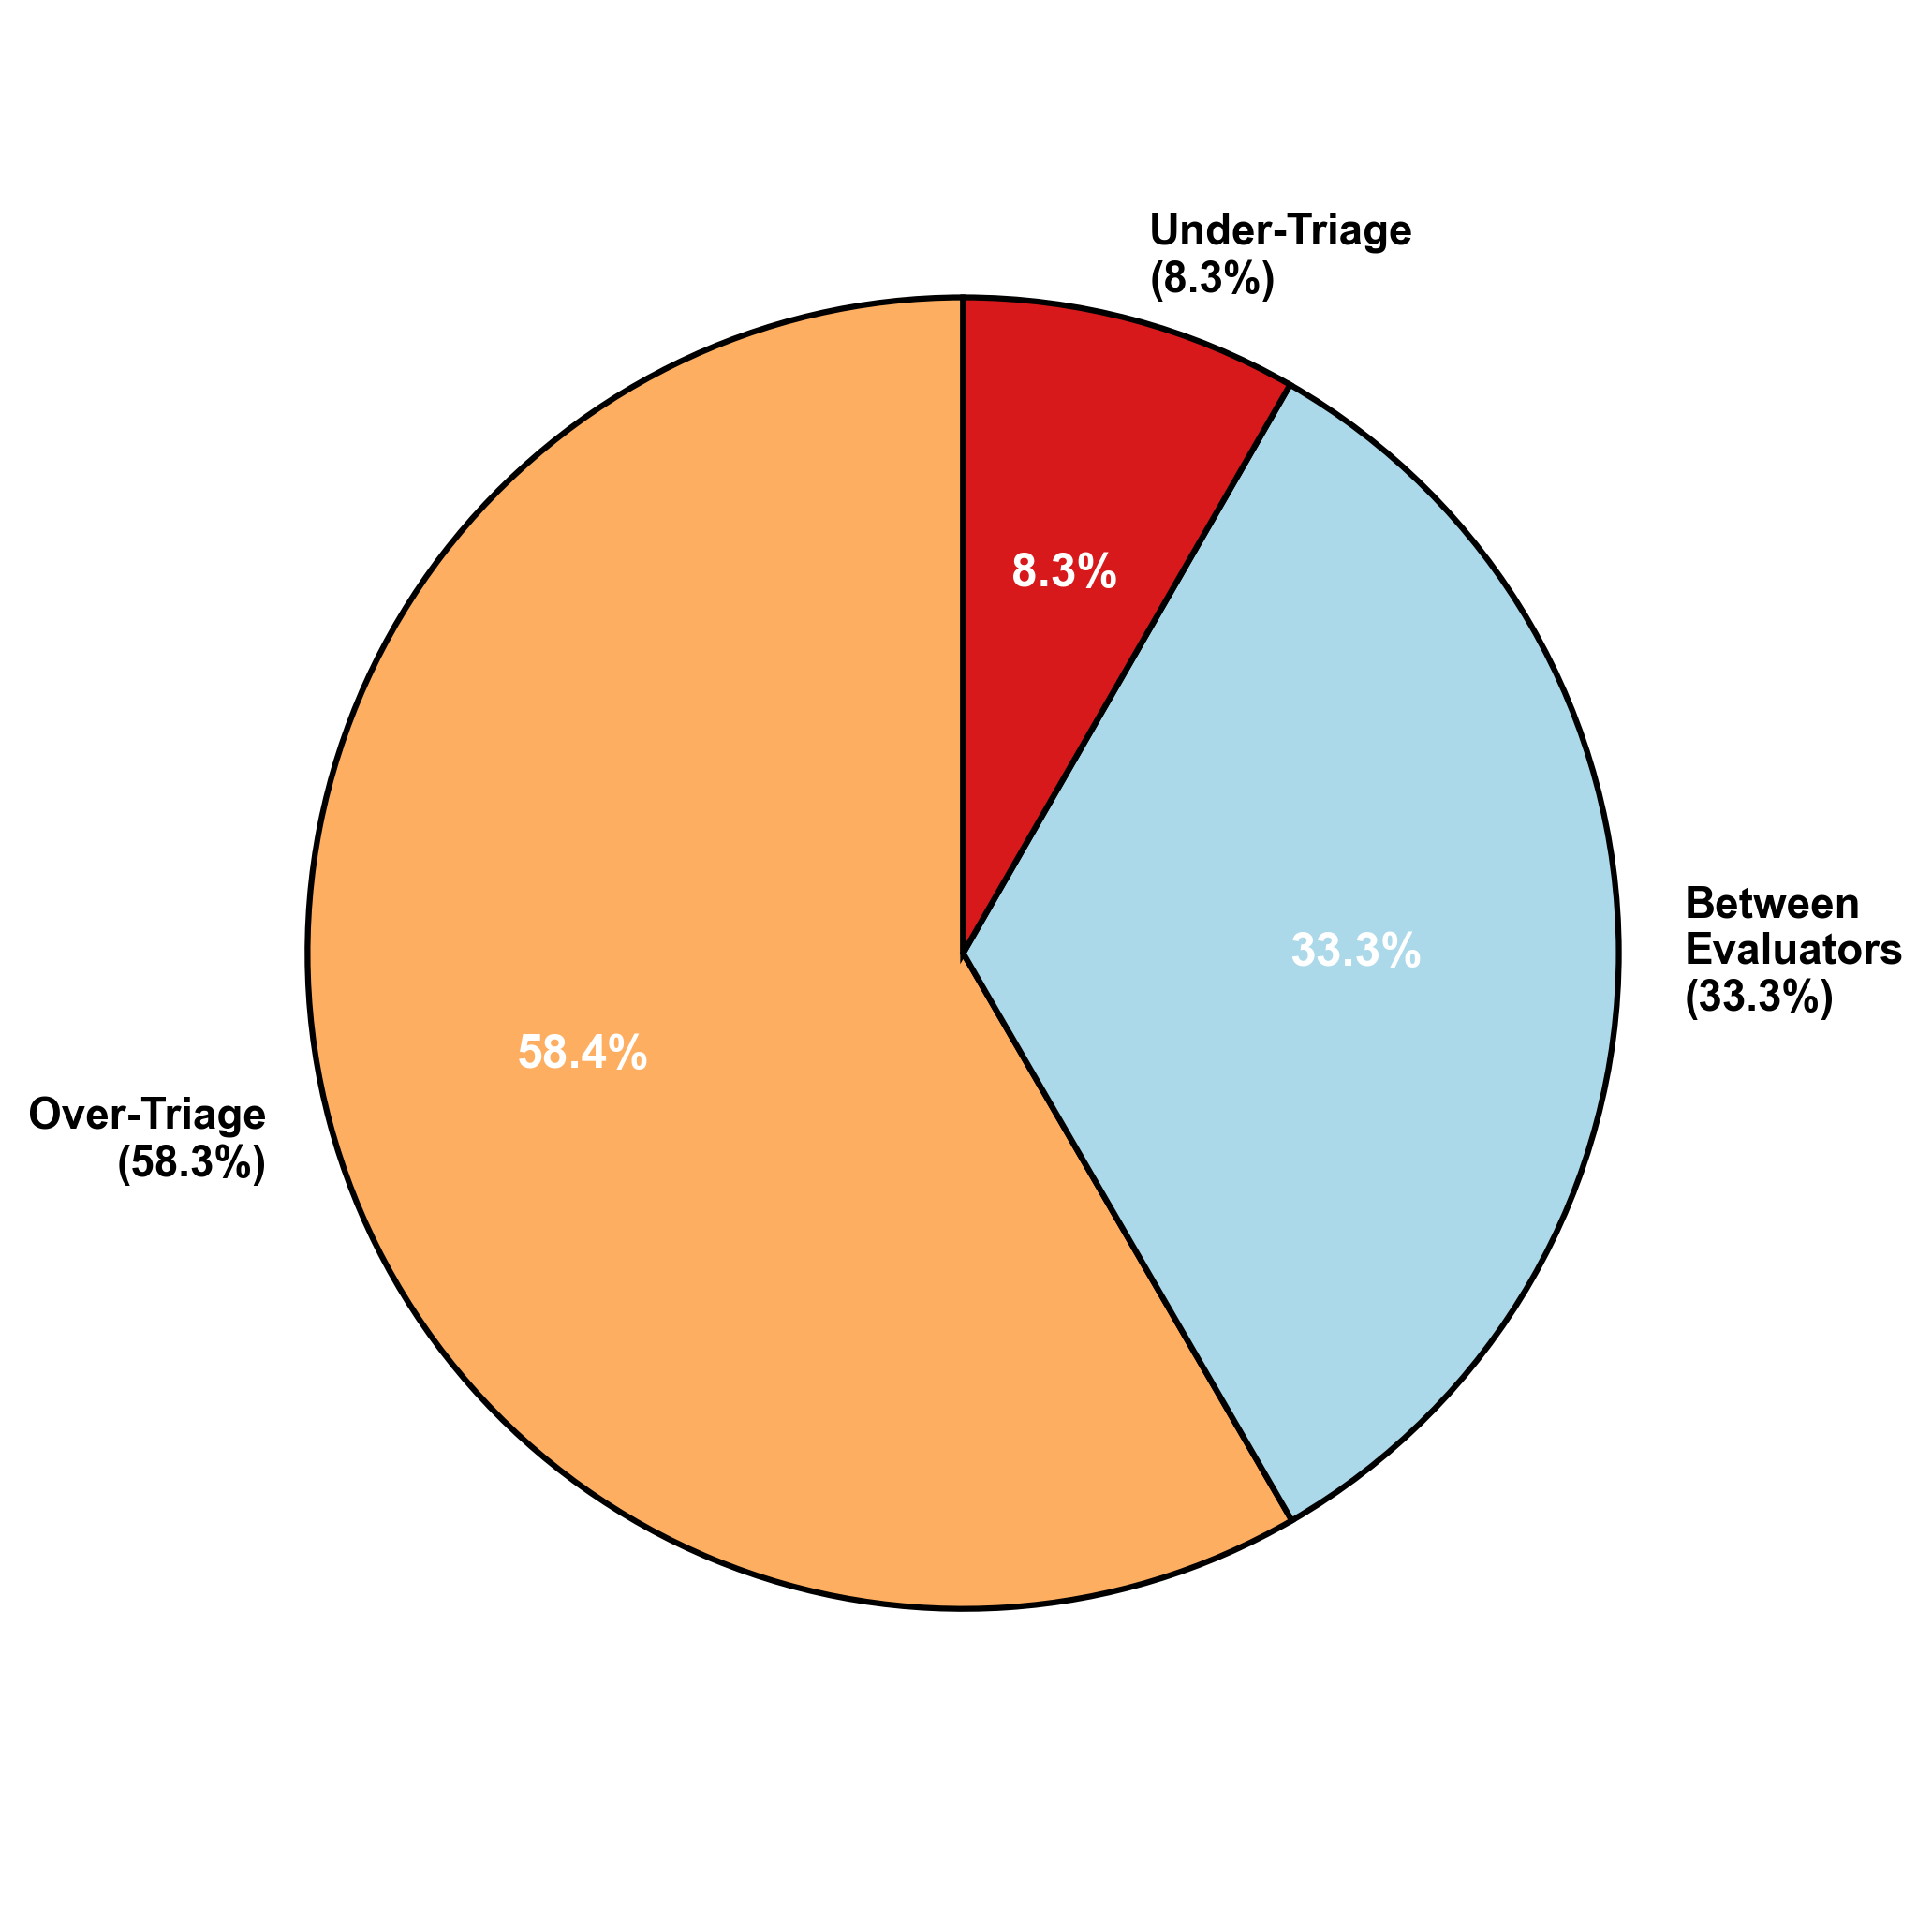
Figure 3. Distribution of AI error patterns after panel review (n=12). The majority of errors (58.3%) were over-triage classifications, where the AI assigned higher urgency than the panel consensus, reflecting a conservative safety bias.
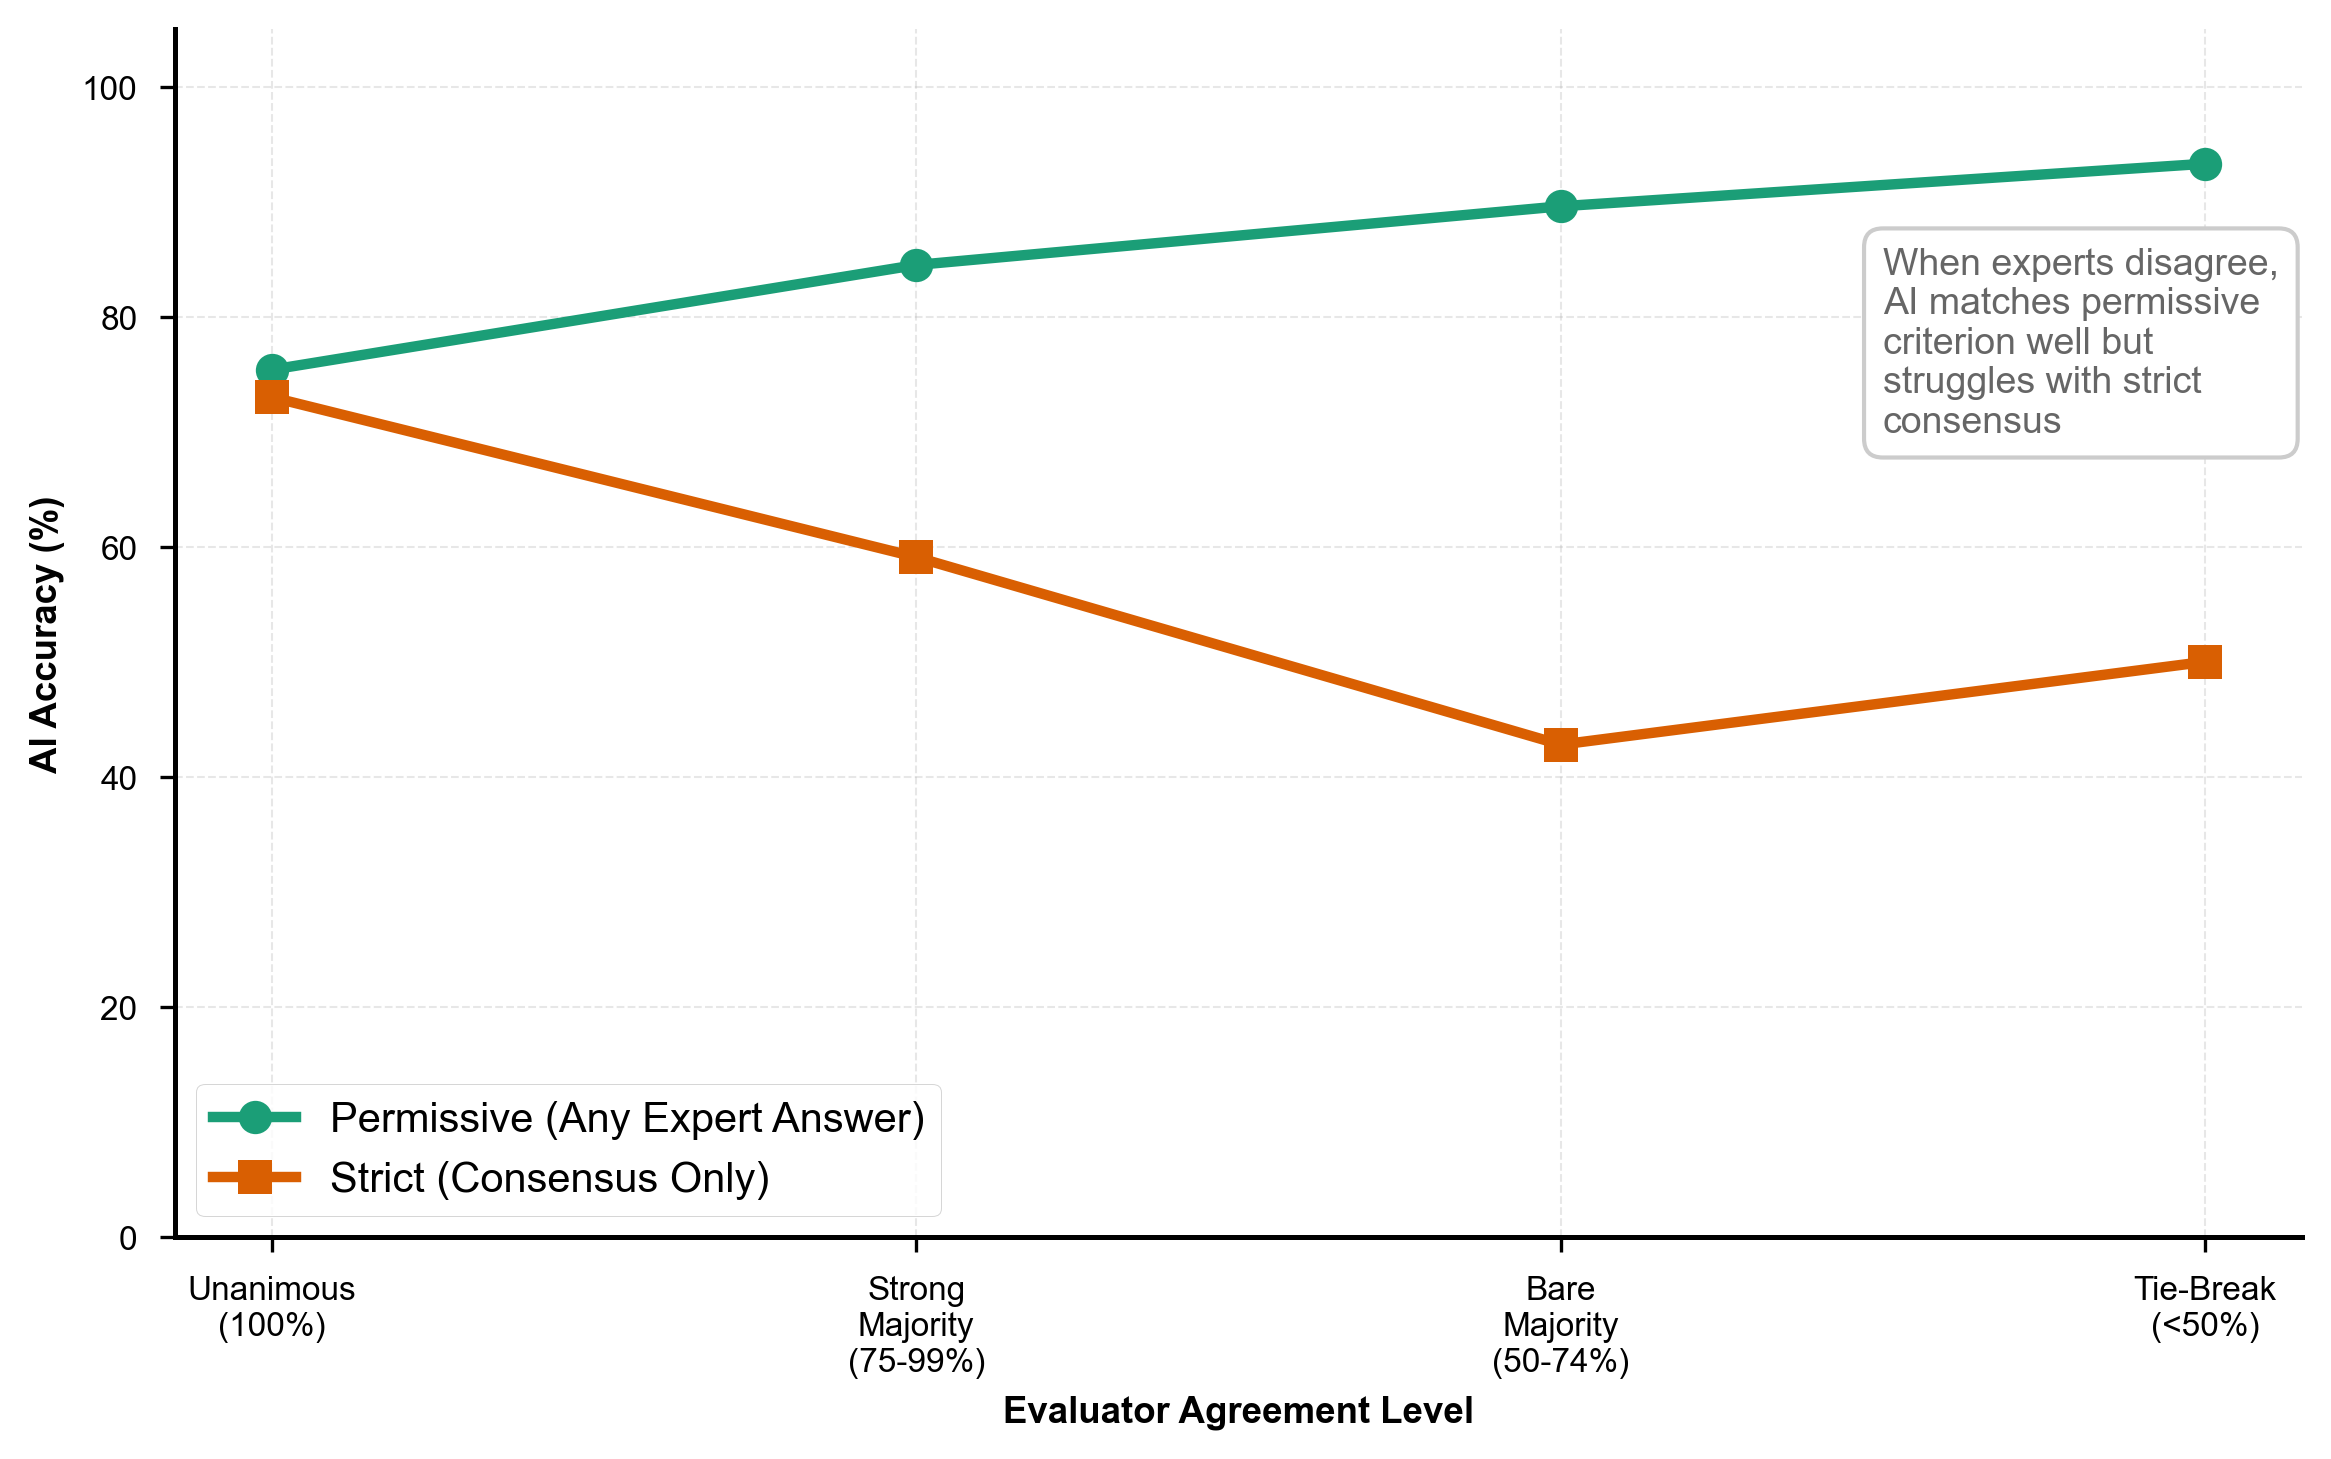
Figure 4. AI performance under permissive versus strict criteria. The permissive criterion (green line) accepts any expert-endorsed answer, while the strict criterion (orange line) requires exact consensus match. The divergence demonstrates that most AI "errors" reflect alternative valid interpretations rather than clinical incorrectness.
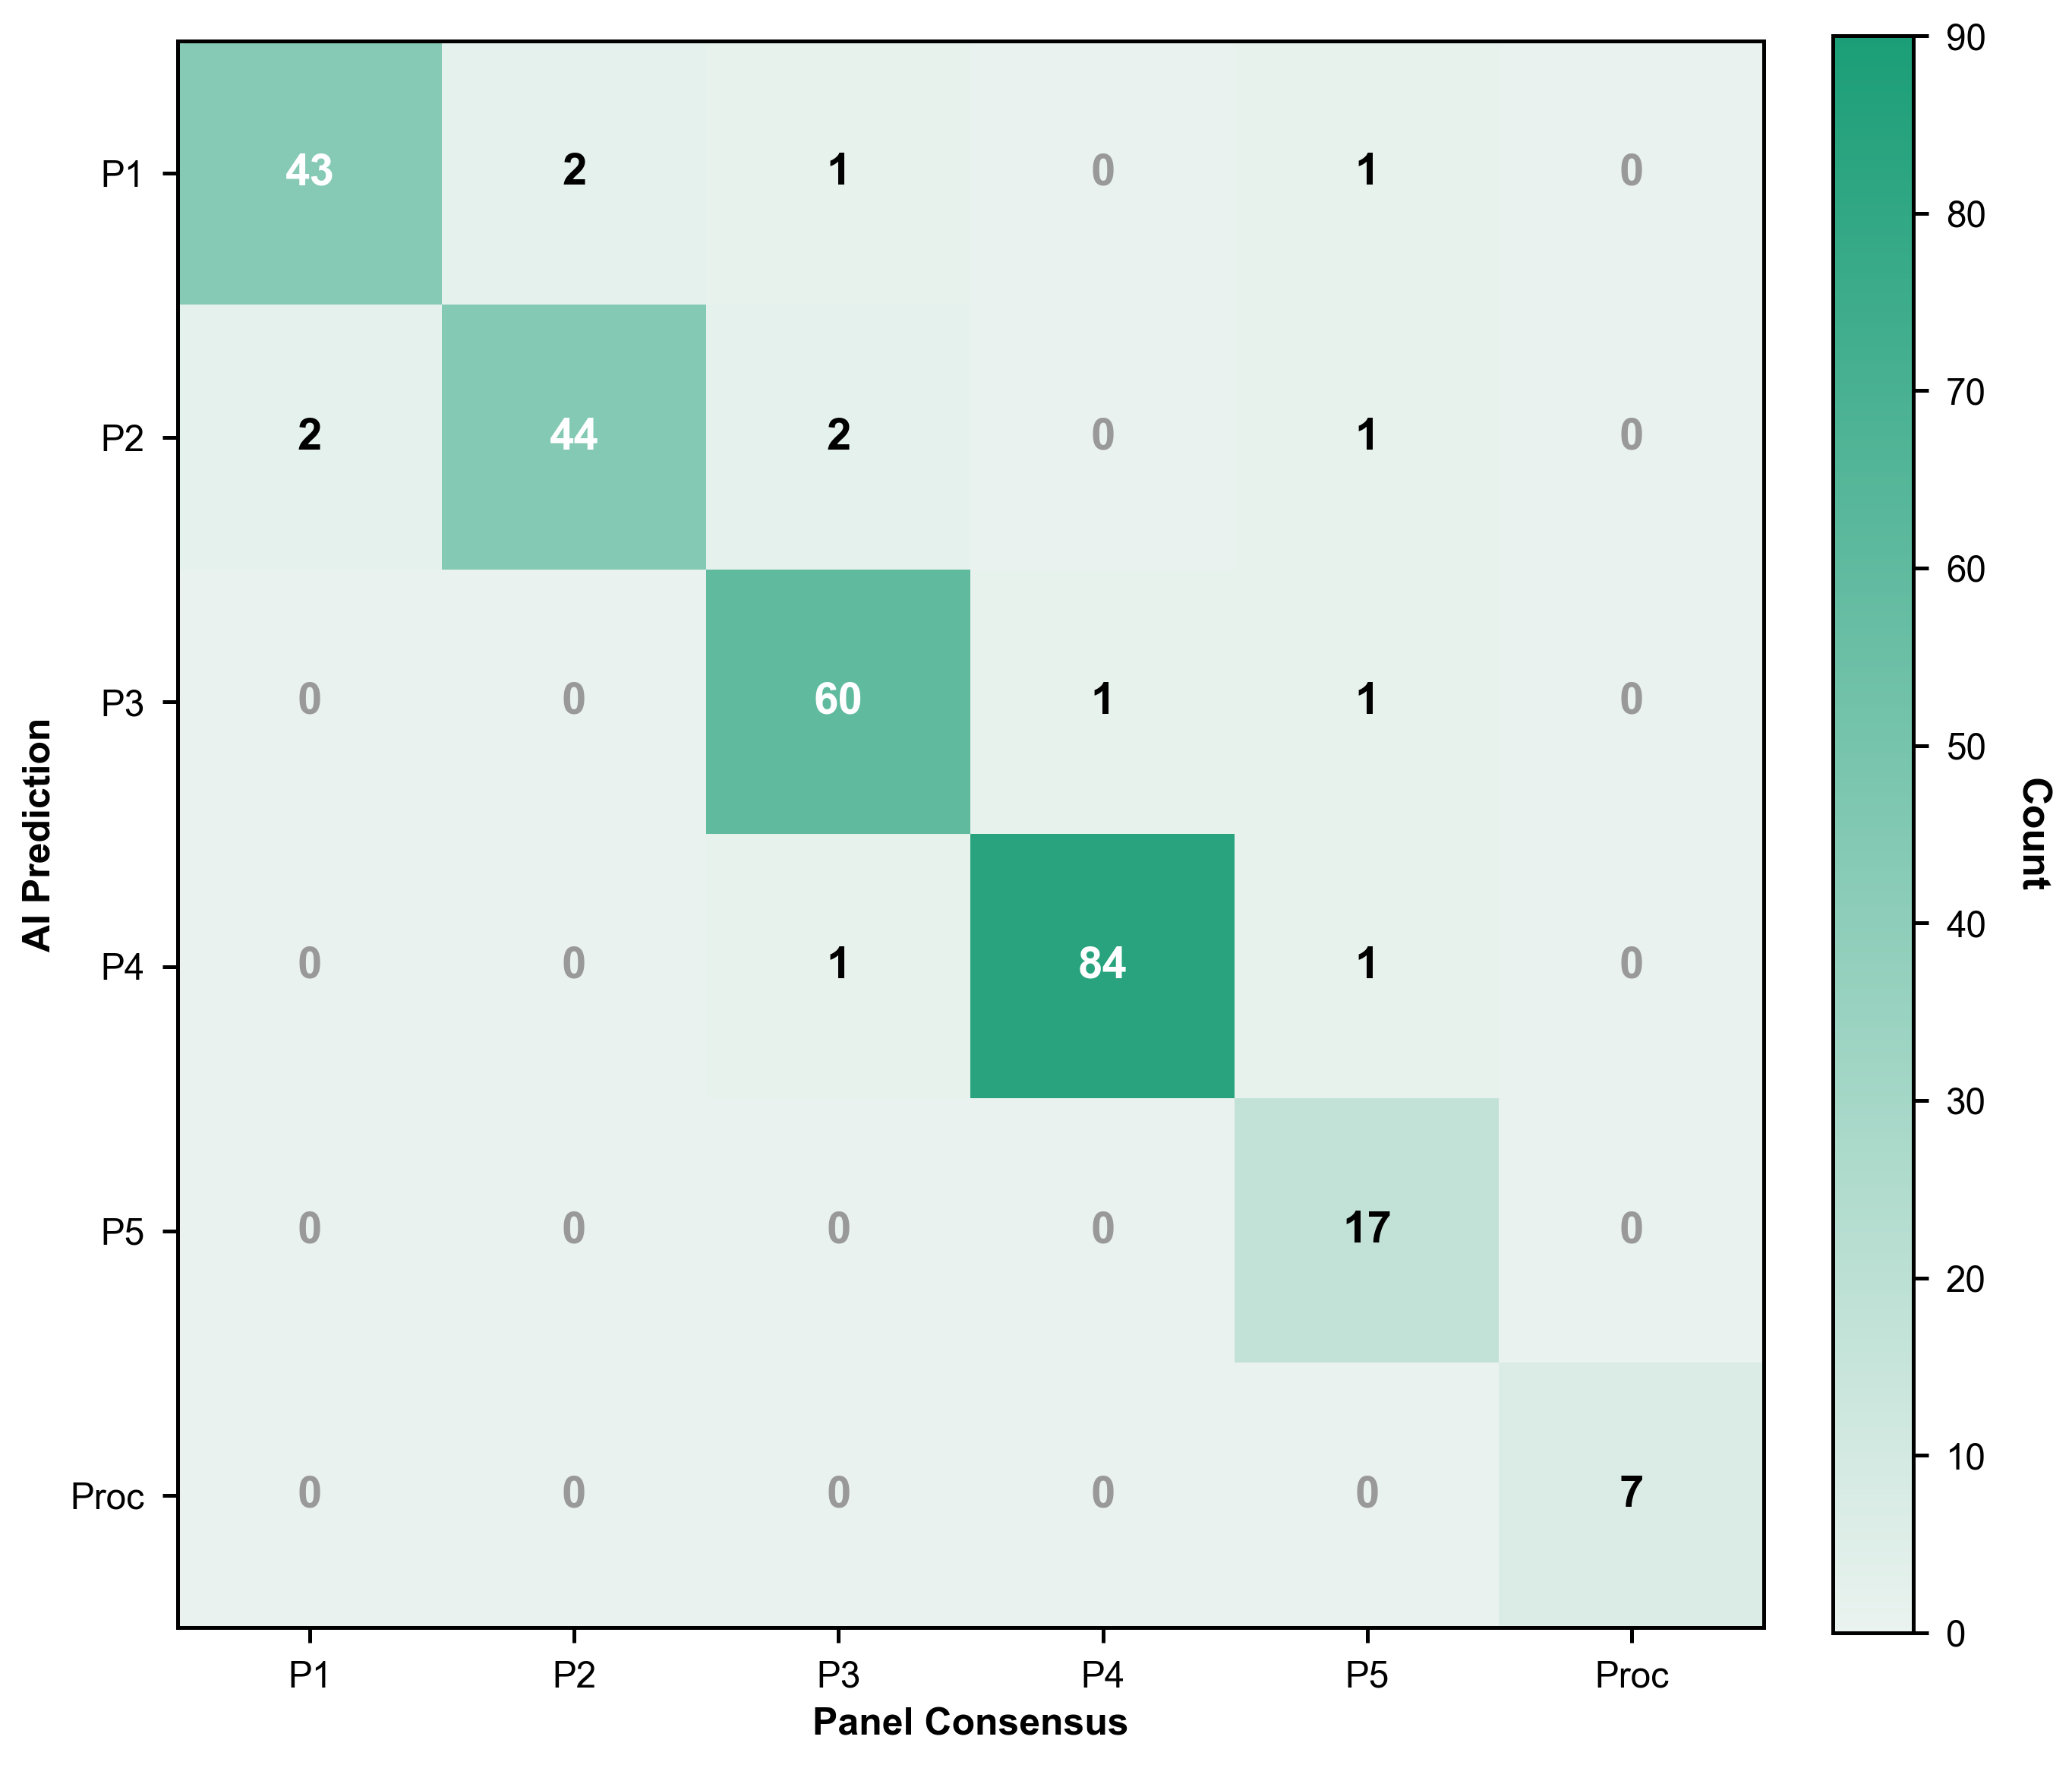
Figure 5. Confusion matrix showing AI predictions versus panel consensus for priority classifications. Diagonal elements (green gradient) represent correct predictions; off-diagonal elements indicate misclassifications. Most errors occurred between adjacent priority levels.
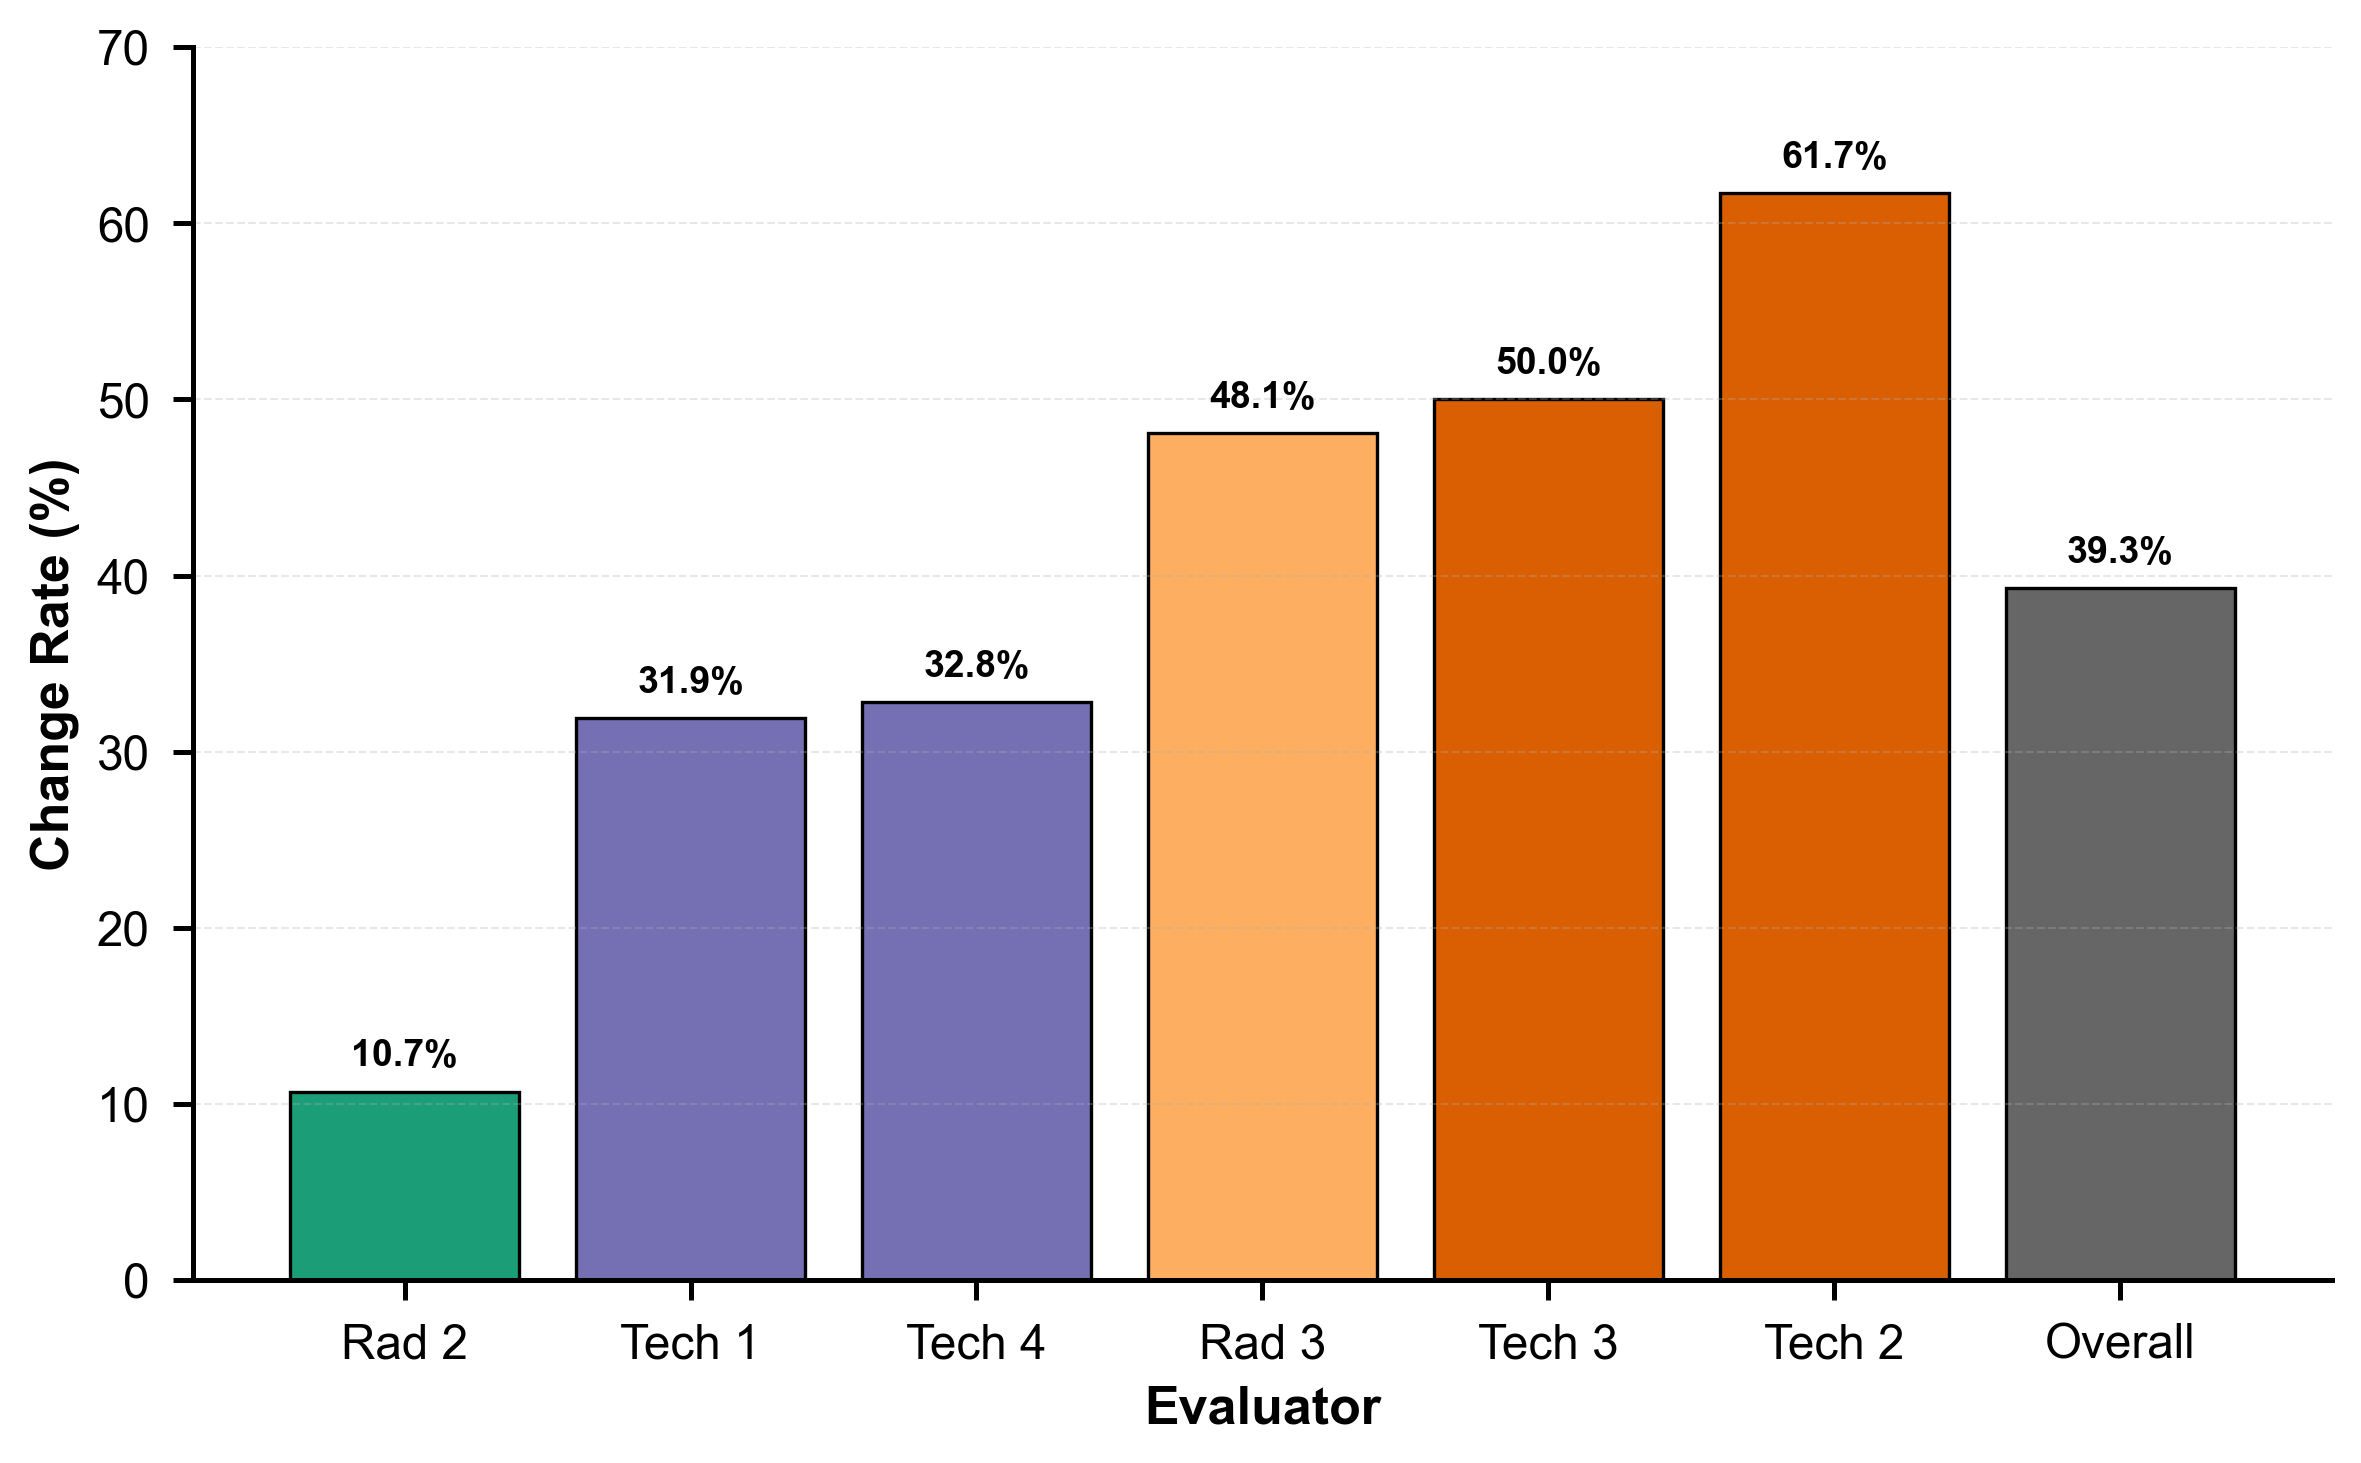
Figure 6. Intra-rater variability measured by answer change rates on re-evaluation. Individual evaluators changed their priority assignments in 10.7%–61.7% of re-reviewed cases (overall: 39.3%), highlighting inherent human inconsistency in clinical triage decisions.